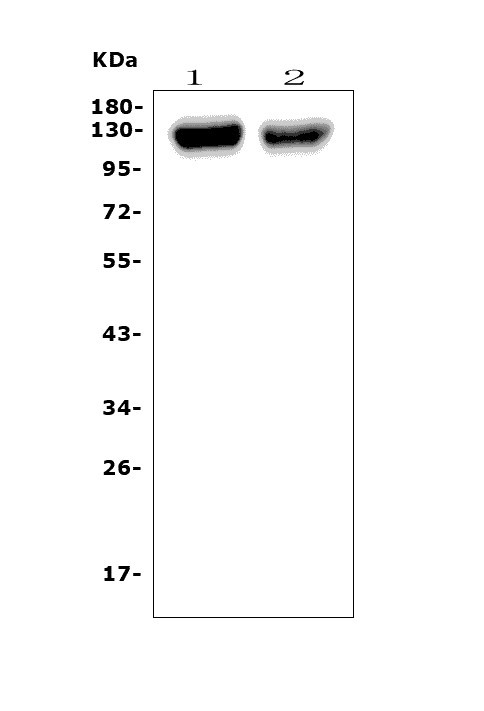
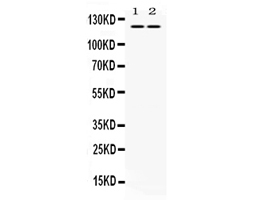
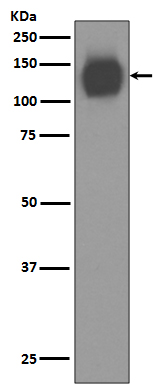
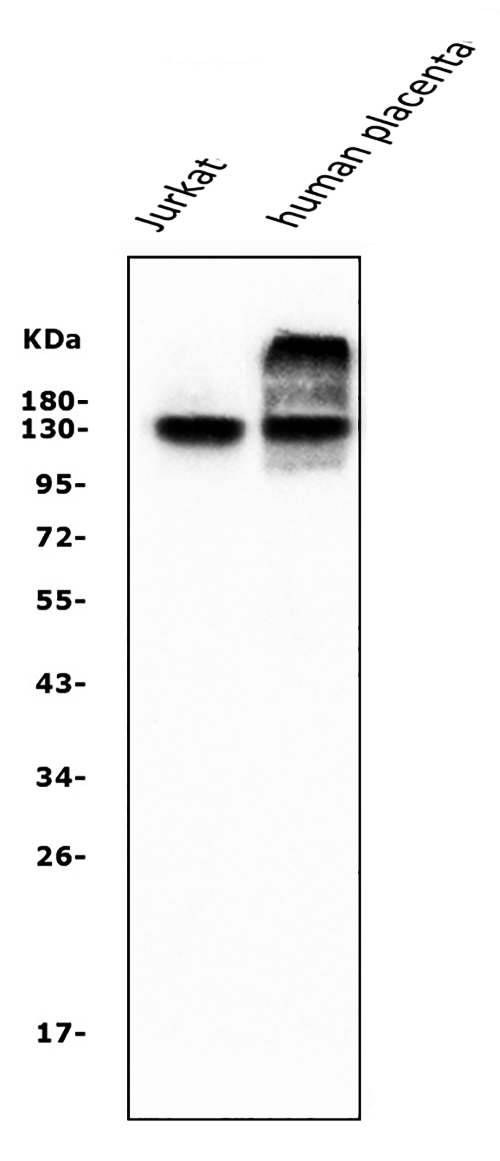
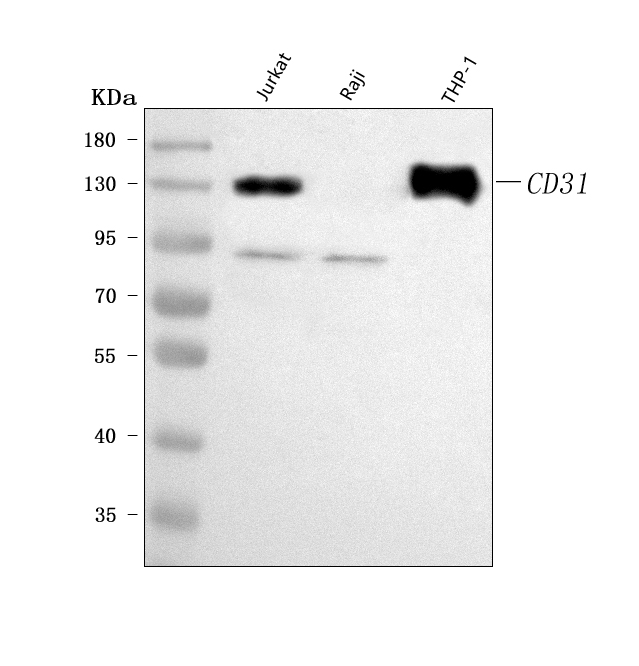
Figure 1. Western blot analysis of anti-Pecam1 antibody (A01513-2).The sample well of each lane was loaded with 50ug of sample under reducing conditions.Lane 1: rat lung tissue lysates,Lane 2: mouse lung tissue lysates.Use rabbit anti- Pecam1 1:1000, probed with a goat anti-rabbit IgG-HRP secondary antibody. The signal is developed using an Enhanced Chemiluminescent detection (ECL) kit (Catalog # EK1002). A specific band was detected for Pecam1 at approximately 120-130KD. The expected band size for Pecam1 is at 82KD.
all(3)
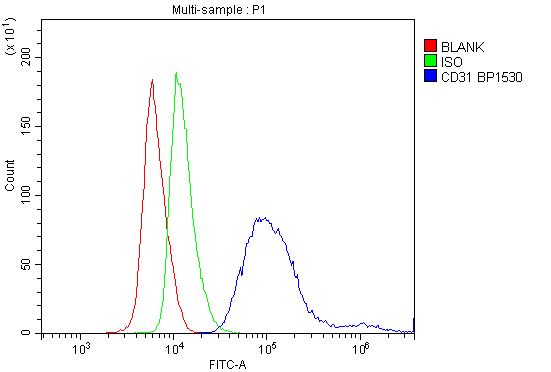
Figure 2. Flow cytometry analysis of mouse spleen cell(1:100) DyLight488 conjugated goat anti-rabbit IgG(blue) was used as secondary antibody. Isotype control antibody (Green line) was rabbit IgG DyLight488. Unlabelled sample (Red line).
all(3) 
| Western blot (WB): | 1:500-2000 |
| Flow Cytometry (Fixed): | 1:50-200 |
| Enzyme linked immunosorbent assay (ELISA): | 1:100-1000 |
Figure 1. Western blot analysis of anti-Pecam1 antibody (A01513-2).The sample well of each lane was loaded with 50ug of sample under reducing conditions.Lane 1: rat lung tissue lysates,Lane 2: mouse lung tissue lysates.Use rabbit anti- Pecam1 1:1000, probed with a goat anti-rabbit IgG-HRP secondary antibody. The signal is developed using an Enhanced Chemiluminescent detection (ECL) kit (Catalog # EK1002). A specific band was detected for Pecam1 at approximately 120-130KD. The expected band size for Pecam1 is at 82KD.
Figure 2. Flow cytometry analysis of mouse spleen cell(1:100) DyLight488 conjugated goat anti-rabbit IgG(blue) was used as secondary antibody. Isotype control antibody (Green line) was rabbit IgG DyLight488. Unlabelled sample (Red line).
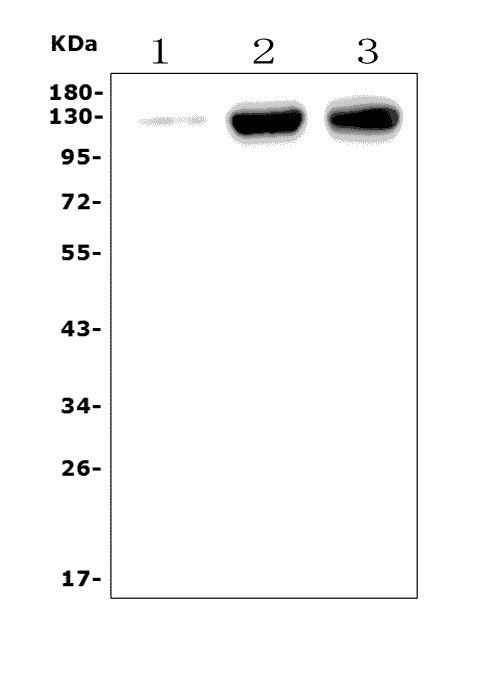
 联系我们
联系我们027-67845390
 关注我们
关注我们
本司产品仅用于科研,不用于临床诊断和治疗
联系方式:027-67845390/1/2 技术支持:武汉丰网
© 1993-2025 Boster Biological Technology co.Itd E-mail:boster@boster.com
鄂ICP备05005548号-2
 鄂公网安备 42018502007312号

 积分商城
积分商城  购物车
购物车  登录/注册
登录/注册  您当前的位置:
  一键复制产品信息
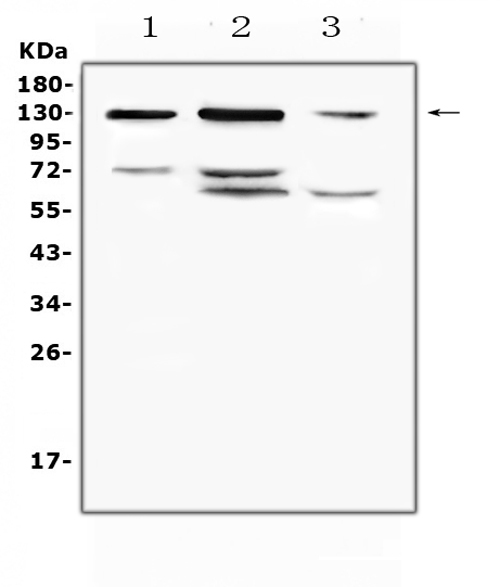


 成功添加到购物车
 微信客服
微信客服


 微信扫一扫立即咨询
